Log Analytics Simple Mode

Simple Mode – I have mixed feelings. Yes, Simple Mode in Azure Monitor Log Analytics is useful. Yes, it makes querying logs easier. But does it strip away too much of the power that Kusto Query Language (KQL) offers? Let’s break it down.


What is Simple Mode?

Simple Mode is Microsoft’s latest attempt to make Azure Monitor’s Log Analytics more accessible. Instead of writing KQL queries, you can now use a simplified, form-based approach to retrieve logs. This means:

No more KQL wrangling for simple queries
Drop-down selections to filter logs
Pre-built query templates for common scenarios

It’s perfect for beginners and those who just want quick answers without learning the intricacies of KQL. But for those of us who love the flexibility and depth of KQL, it feels a bit… underwhelming.


Where Simple Mode Shines

Okay, I’ll admit—it has its moments:

  1. Fast Troubleshooting – Need to check VM performance? Find failed logins? Simple Mode makes it quick.
  2. Less Query Anxiety – Not everyone wants to remember where TimeGenerated >= ago(7d). Fair enough.
  3. Better Team Accessibility – Non-technical users (like project managers or business analysts) can actually use Log Analytics now.

It’s a great tool for entry-level users, and it can certainly speed up basic troubleshooting.


Where It Falls Short (for Power Users)

If you’re used to writing KQL like a pro, Simple Mode will probably feel like training wheels on a motorcycle.

🔻 Limited Query Complexity – No advanced joins, unions, or calculated fields
🔻 Less Control Over Data Filtering – Drop-downs are great until you need a specific filter that isn’t there
🔻 Can Hide Critical Insights – Sometimes, the best debugging happens in the nitty-gritty details, which Simple Mode glosses over

It’s like being handed a “Dummies Guide to PowerShell” when you’ve been scripting automation for years. You appreciate the effort, but it’s just… not for you.


Can You Still Use KQL?

Thankfully YES. Microsoft isn’t forcing Simple Mode on us. You can toggle back to KQL mode whenever you want.

  1. Start with Simple Mode
  2. Switch to KQL Mode when you need more control
  3. Mix and match based on what you need

It’s a decent compromise, but I wouldn’t be surprised if Microsoft keeps nudging us toward using Simple Mode more in the future.
2024 Year End – Azure Monitor

Let’s take a look back at the year and see what major features the Program Groups delivered!

Cya, old AppInsights!

One of the most notable milestones was the retirement of Classic Application Insights on February 29, 2024. This move encouraged users to transition to workspace-based resources, offering improved integration and advanced features within Azure Monitor.

Farewell MMA/OMS

Although some people will say OMS was never a thing (Bwren – talking about you), August 31, 2024, marked the retirement of the Log Analytics Agent (MMA/OMS). Users were advised to migrate to the Azure Monitor Agent (AMA) to benefit from enhanced performance, security, and support for new data sources.

Classic Storage Metrics

On January 9, 2024, classic metrics in Azure Storage were retired.

Enhanced Logging for AKS

December 2024 brought significant enhancements to Azure Kubernetes Service (AKS) logging. New metadata and log severity levels were introduced in Azure Monitor Logs, providing more granular insights into AKS operations.

Azure Monitor Baseline Alerts

Monitoring without a solid strategy is like driving without a dashboard—sooner or later, something’s going to break, and you won’t see it coming. That’s where Azure Monitor Baseline Alerts (AMBA) steps in, acting as your pre-configured, expert-driven monitoring blueprint for Azure resources.

Instead of spending hours manually configuring alerts, AMBA provides ready-to-deploy alert recommendations, automation templates, and best practices to ensure your environment stays resilient and well-monitored from day one.

Expert Recommendations: AMBA offers a curated list of alert recommendations and expert guidance tailored for various Azure resources, ensuring you’re always ahead of potential issues.

Proactive Notifications: With near real-time alerts, AMBA ensures you can swiftly identify and address problems, minimizing downtime and maintaining optimal performance.

Seamless Automation: Deploying alert policies has never been easier. AMBA’s Azure Policy templates allow for consistent and efficient implementation across your environment.

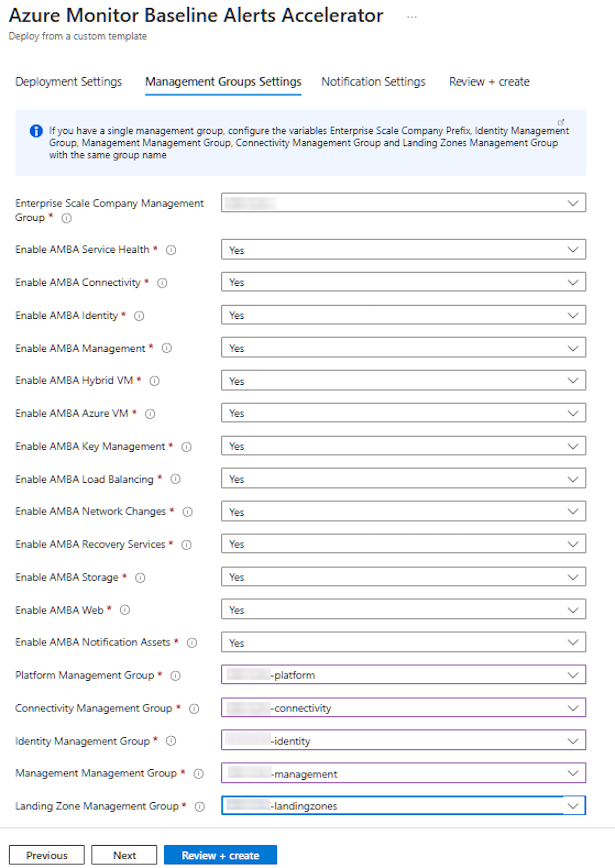
There are three main sections in AMBA – Resources, Patterns/Scenarios, and Visualizations. AMBA will deploy the necessary alerts based on resource level guidance with patterns (for Azure Landing Zones), along with various workbooks, dashboards – Azure or Grafana. And to top it all off – there is an accelerator now available for it! (see the image below)

Private Preview – Dynamic Log Alerts!

Let’s face it—manually setting alert thresholds in Azure Monitor can feel like trying to hit a moving target while blindfolded. Just when you think you’ve nailed the perfect threshold, your application’s behavior decides to take a detour, leaving you drowning in false positives or, worse, missing critical alerts. Azure Monitor’s dynamic thresholds for log search alerts are here to save the day!

Why Dynamic Thresholds Are a Game-Changer

Dynamic thresholds in Azure Monitor analyze historical data to establish expected performance patterns, automatically adjusting alert thresholds as your application’s behavior changes.

  • Automatic Calibration – Say goodbye to manual tuning. Dynamic thresholds adjust themselves based on your system’s historical data
  • Intelligent Learning – By understanding patterns and trends—be it daily spikes or weekly lulls—dynamic thresholds adapt to your application’s changing situations.
  • Scalable Alerts – Dynamic thresholds allow for a single alert rule to handle multiple dimensions, defining specific alert bands for each combination.

It’s still in Private Preview (boo!), but it won’t be long before we get our hands on it in public preview!

So what does it look like? Here is a sample ARM template that sets a dynamic threshold on CPU percentage – notice the new criterionType of DynamicThresholdCriterion.

{
  "$schema": "https://schema.management.azure.com/schemas/2019-04-01/deploymentTemplate.json#",
  "contentVersion": "1.0.0.0",
  "parameters": {
    "scheduledqueryrules_PerfDemoRule_name": {
      "defaultValue": "PerfDemoRule",
      "type": "String"
    },
    "workspaces_PerfDemoWorkspace_externalid": {
      "defaultValue": "/subscriptions/XXXX-XXXX-XXXX-XXXX/resourceGroups/XXXX/providers/Microsoft.OperationalInsights/workspaces/PerfDemoWorkspace",
      "type": "String"
    }
  },
  "resources": [
    {
      "type": "microsoft.insights/scheduledqueryrules",
      "apiVersion": "2024-01-01-preview",
      "name": "[parameters('scheduledqueryrules_PerfDemoRule_name')]",
      "location": "eastus2",
      "properties": {
        "displayName": "[parameters('scheduledqueryrules_PerfDemoRule_name')]",
        "severity": 3,
        "enabled": true,
        "evaluationFrequency": "PT5M",
        "scopes": [
          "[parameters('workspaces_PerfDemoWorkspace_externalid')]"
        ],
        "targetResourceTypes": [
          "Microsoft.Compute/virtualMachines"
        ],
        "criteria": {
          "allOf": [
            {
              "criterionType": "DynamicThresholdCriterion",
              "metricName": "Percentage CPU",
              "timeAggregation": "Average",
              "dimensions": [
                {
                  "name": "Computer",
                  "operator": "Include",
                  "values": [ "*" ]
                }
              ],
              "alertSensitivity": "Medium"
            }
          ]
        }
      }
    }
  ]
}

Azure Monitor Agent: Time to Ditch the Old and Embrace the New

Hey there fellow geeks! If you’ve been snoozing on Azure updates, it’s time to wake up and smell the deprecation notices. As of August 31, 2024, the trusty old Log Analytics Agent (also known as MMA) is heading to the retirement home. That’s right—Microsoft is pulling the plug.

But don’t panic! The Azure Monitor Agent (AMA) is here to save the day, offering a sleeker, more efficient way to keep tabs on your virtual machines and servers. Let’s dive into why you should make the switch and how to do it without breaking a sweat.


Why Should You Care?

The Log Analytics Agent has been a faithful companion, but it’s showing its age. The Azure Monitor Agent brings a host of improvements:

  • Centralized Configuration: Manage multiple VMs with ease from a single pane of glass.
  • Enhanced Performance: Less resource hogging, more monitoring efficiency.
  • Better Security: Tighter integration with Azure’s security features to keep those pesky threats at bay.
  • Support for More Data Sources: Broader data collection to give you a more comprehensive view of your environment.

The Clock Is Ticking: Migration Steps

Alright, let’s get down to business. Here’s how to bid farewell to MMA and roll out AMA like a pro:

  1. Assess Your Current Setup: Identify all VMs and servers still running the Log Analytics Agent.
  2. Plan the Migration: Determine the order of migration, considering critical systems first.
  3. Install the Azure Monitor Agent: Use Azure Policy or deployment scripts to install AMA across your resources.
  4. Configure Data Collection: Set up data collection rules to specify what data to gather and where to send it.
  5. Test the Setup: Ensure AMA is collecting data as expected before decommissioning MMA.
  6. Decommission the Old Agent: Once confirmed, uninstall the Log Analytics Agent from your systems.

For a detailed walkthrough, check out Microsoft’s official guide: Migrate to Azure Monitor Agent.


Don’t Be That Person

Procrastination is the enemy here. Delaying the migration could leave your systems unsupported and vulnerable. Plus, who wants to be scrambling at the last minute? Get ahead of the curve and make the switch to AMA today.

Remember, change is inevitable—except from a vending machine. Embrace the new, retire the old, and keep your monitoring game strong. Learn more about the Azure Monitor Agent.

Happy migrating!

Quick Code – Install AMA and Assign a DCR with PowerShell

Happy Holidays! Here’s a quick post to share some code that will inventory Azure VMs, install the AMA if necessary, and then assign a DCR to the VM.

# Ensure you're logged in to Azure
Connect-AzAccount

# Define the Data Collection Rule (DCR) resource ID
$dcrResourceId = "<Your-DCR-Resource-ID>"

# Get all VMs in the subscription
$vms = Get-AzVM

# Use ForEach-Object with -Parallel to process VMs concurrently
$vms | ForEach-Object -Parallel {
    $vm = $_
    $osType = $vm.StorageProfile.OsDisk.OsType
    $extensionName = if ($osType -eq "Windows") { "AzureMonitorWindowsAgent" } else { "AzureMonitorLinuxAgent" }
    $extensionPublisher = "Microsoft.Azure.Monitor"
    $vmResourceId = "/subscriptions/$using:vm.SubscriptionId/resourceGroups/$using:vm.ResourceGroupName/providers/Microsoft.Compute/virtualMachines/$using:vm.Name"

    try {
        # Check if the Azure Monitor Agent extension is installed
        $amaExtension = Get-AzVMExtension -ResourceGroupName $using:vm.ResourceGroupName -VMName $using:vm.Name -Name $extensionName -ErrorAction SilentlyContinue

        if (-not $amaExtension) {
            try {
                # Install the Azure Monitor Agent extension
                Set-AzVMExtension -ResourceGroupName $using:vm.ResourceGroupName -VMName $using:vm.Name -Name $extensionName -Publisher $extensionPublisher -ExtensionType $extensionName -TypeHandlerVersion "1.0" -Location $using:vm.Location
                Write-Host "Installed Azure Monitor Agent on $($using:vm.Name)"
            } catch {
                Write-Host "Failed to install Azure Monitor Agent on $($using:vm.Name): $_"
            }
        } else {
            Write-Host "Azure Monitor Agent is already installed on $($using:vm.Name)"
        }
    } catch {
        Write-Host "Error checking Azure Monitor Agent on $($using:vm.Name): $_"
    }

    try {
        # Assign the DCR to the VM
        $settings = @{ "dataCollectionRuleResourceIds" = @($using:dcrResourceId) }
        Set-AzVMExtension -ResourceGroupName $using:vm.ResourceGroupName -VMName $using:vm.Name -Name "AzureMonitorVmExtension" -Publisher $extensionPublisher -ExtensionType $extensionName -Settings $settings -Location $using:vm.Location
        Write-Host "Assigned DCR to $($using:vm.Name)"
    } catch {
        Write-Host "Failed to assign DCR to $($using:vm.Name): $_"
    }
} -ThrottleLimit 5 # Adjust the ThrottleLimit as necessary

Creating Alert Rules in Azure with AZ PowerShell – Some Samples

Let go over a simple one – how to create various types of alert rules in Azure using the AZ PowerShell Module.

Each example targets a different aspect of Azure monitoring, but doesn’t cover them all. Remember to tweak the parameters to match your environment.

Metric Alerts for Performance Monitoring

To keep an eye on Azure service metrics:

$criteria = New-AzMetricAlertRuleV2Criteria -MetricName 'Percentage CPU' -TimeAggregation Average -Operator GreaterThan -Threshold 80

Add-AzMetricAlertRuleV2 -Name 'HighCPUAlert' -ResourceGroupName 'YourResourceGroupName' -WindowSize 00:05:00 -Frequency 00:01:00 -TargetResourceId '/subscriptions/yourSubscriptionId/resourceGroups/yourResourceGroupName/providers/Microsoft.Compute/virtualMachines/yourVMName' -Condition $criteria -ActionGroup '/subscriptions/yourSubscriptionId/resourceGroups/yourResourceGroupName/providers/microsoft.insights/actionGroups/yourActionGroupName' -Severity 3 -Description 'Alert on high CPU usage.'

Log Alerts for Custom Log Queries

For alerts based on log analytics:

$query = "AzureActivity | where OperationName == 'Create or Update Virtual Machine' and ActivityStatus == 'Succeeded'"

Set-AzScheduledQueryRule -ResourceGroupName 'YourResourceGroupName' -Location 'East US' -ActionGroup '/subscriptions/yourSubscriptionId/resourceGroups/yourResourceGroupName/providers/microsoft.insights/actionGroups/yourActionGroupName' -ConditionQuery $query -Description "VM creation alert" -Enabled $true -EvaluationFrequency 'PT5M' -Severity 0 -WindowSize 'PT5M' -Name 'VMCreationAlert'

Activity Log Alerts for Azure Resource Events

To monitor specific Azure service events:

$condition = New-AzActivityLogAlertCondition -Field 'category' -Equal 'Administrative'
$actionGroupId = "/subscriptions/yourSubscriptionId/resourceGroups/yourResourceGroupName/providers/microsoft.insights/actionGroups/yourActionGroupName"

Set-AzActivityLogAlert -Location 'Global' -Name 'AdminActivityAlert' -ResourceGroupName 'YourResourceGroupName' -Scopes "/subscriptions/yourSubscriptionId" -Condition $condition -ActionGroupId $actionGroupId -Description "Alert on administrative activities"

Application Insights Alerts for Application Performance

Track application performance with a simple AppInsights web test

$rule = New-AzApplicationInsightsWebTestAlertRule -Name 'AppPerfAlert' -ResourceGroupName 'YourResourceGroupName' -Location 'East US' -WebTestId '/subscriptions/yourSubscriptionId/resourceGroups/yourResourceGroupName/providers/microsoft.insights/webtests/yourWebTestId' -FailedLocationCount 3 -WindowSize 'PT5M' -Frequency 'PT1M' -Criteria $criteria

Set-AzApplicationInsightsWebTestAlertRule -InputObject $rule