MCP in Copilot Studio?!?

Microsoft has just unveiled the Model Context Protocol (MCP) in Copilot Studio – and let me tell you this is amazing.

What’s New: Model Context Protocol Integration

So, what’s the big deal with MCP? Imagine being able to hook up your AI models directly to existing knowledge servers and APIs without breaking a sweat. MCP allows makers to connect to these resources seamlessly within Copilot Studio. Once connected, actions and knowledge are automatically added to your agent and kept up-to-date as functionalities evolve, reducing the time you spend on maintenance. ​Want your AI model to query a SQL server? Done. Want your AI model to consume some random Kafka topic? No sweat! Need AI to open a Github PR? Easy.

MCP servers utilize connector infrastructure, meaning they come equipped with enterprise security and governance controls like Virtual Network integration and Data Loss Prevention.Multiple authentication methods are also supported, ensuring that you aren’t a bonehead that uses anonymous access.

Getting Started with MCP

Ready to dive in? Here’s a quick guide to integrating MCP into your Copilot Studio experience:

  1. Create the Server: Use one of the available SDKs to set up your MCP server. This will act as the foundation for handling your data, models, and interactions.
  2. Publish Through a Connector: Develop a custom connector that links your Copilot Studio environment to your model or data source.
  3. Consume the Data via Copilot Studio: Once your server and connector are in place, start interacting with your models and data directly through Copilot Studio.

This process not only reduces manual effort but also minimizes the risk of errors from outdated tools. Plus, a single MCP server can manage multiple tools! This is simply amazing!

Log Analytics Simple Mode

Simple Mode – I have mixed feelings. Yes, Simple Mode in Azure Monitor Log Analytics is useful. Yes, it makes querying logs easier. But does it strip away too much of the power that Kusto Query Language (KQL) offers? Let’s break it down.


What is Simple Mode?

Simple Mode is Microsoft’s latest attempt to make Azure Monitor’s Log Analytics more accessible. Instead of writing KQL queries, you can now use a simplified, form-based approach to retrieve logs. This means:

No more KQL wrangling for simple queries
Drop-down selections to filter logs
Pre-built query templates for common scenarios

It’s perfect for beginners and those who just want quick answers without learning the intricacies of KQL. But for those of us who love the flexibility and depth of KQL, it feels a bit… underwhelming.


Where Simple Mode Shines

Okay, I’ll admit—it has its moments:

  1. Fast Troubleshooting – Need to check VM performance? Find failed logins? Simple Mode makes it quick.
  2. Less Query Anxiety – Not everyone wants to remember where TimeGenerated >= ago(7d). Fair enough.
  3. Better Team Accessibility – Non-technical users (like project managers or business analysts) can actually use Log Analytics now.

It’s a great tool for entry-level users, and it can certainly speed up basic troubleshooting.


Where It Falls Short (for Power Users)

If you’re used to writing KQL like a pro, Simple Mode will probably feel like training wheels on a motorcycle.

🔻 Limited Query Complexity – No advanced joins, unions, or calculated fields
🔻 Less Control Over Data Filtering – Drop-downs are great until you need a specific filter that isn’t there
🔻 Can Hide Critical Insights – Sometimes, the best debugging happens in the nitty-gritty details, which Simple Mode glosses over

It’s like being handed a “Dummies Guide to PowerShell” when you’ve been scripting automation for years. You appreciate the effort, but it’s just… not for you.


Can You Still Use KQL?

Thankfully YES. Microsoft isn’t forcing Simple Mode on us. You can toggle back to KQL mode whenever you want.

  1. Start with Simple Mode
  2. Switch to KQL Mode when you need more control
  3. Mix and match based on what you need

It’s a decent compromise, but I wouldn’t be surprised if Microsoft keeps nudging us toward using Simple Mode more in the future.

Running PowerShell Inline with Azure Standard Logic Apps: Because Sometimes, No-Code is Too Much Work

Azure Logic Apps are fantastic—until you need to do something slightly complex. The built-in workflow language is powerful but, let’s be honest, sometimes writing expressions in that JSON-esque nightmare is more painful than debugging a spaghetti-coded PowerShell script written by an intern.

Enter PowerShell in Azure Logic Apps (Standard Edition)—where you can run inline PowerShell scripts, skipping the need for convoluted @{json_expression} gymnastics.

Why?

Readability: Ever tried debugging a concat(split(base64(binary), ',')) expression? Yeah, me neither. PowerShell is just easier to read and debug.

Flexibility: You can manipulate JSON, handle dates, perform string operations, and even call APIs—all in a single PowerShell script instead of chaining actions together.

Less Clicks, More Code: Instead of adding multiple Compose, Condition, and Parse JSON actions, you can just run a PowerShell script inline and return exactly what you need.

How to Run PowerShell in Azure Standard Logic Apps

Step 1: Add the Inline Code Action

  1. Open your Azure Logic App (Standard Edition).
  2. Click “Add an action” in your workflow.
  3. Search for Inline Code and select it.

Note: This works only in Standard Logic Apps, not Consumption-based ones.

Step 2: Write Your PowerShell Script

The Inline Code action lets you use PowerShell directly inside the workflow.

Here’s a simple example:

param ($inputData)

# Convert input JSON into a PowerShell object
$data = $inputData | ConvertFrom-Json

# Get current timestamp in ISO format
$timestamp = Get-Date -Format "yyyy-MM-ddTHH:mm:ssZ"

# Concatenate values (because Logic Apps JSON expressions are a pain)
$fullName = "$($data.firstName) $($data.lastName)"

# Return an object
@{
    fullName = $fullName
    timestamp = $timestamp
} | ConvertTo-Json -Compress

Step 3: Pass Data Into the Script

  1. Click the “Parameters” section in the Inline Code action.
  2. Add a new parameter (e.g., inputData).
  3. Pass data from a previous action (like an HTTP request, a database call, or another Logic App action).

When executed, the script will return a structured JSON response—without needing multiple Logic App actions for transformation.

Real-World Use Cases

Date Manipulation: Logic Apps date functions are limited, but PowerShell handles them easily.

Complex String Operations: Need to extract a value from a string? Regex it in PowerShell.

API Calls & Data Formatting: Fetch data, process it, and return the exact structure you need.

PowerShell in Logic Apps Standard is a game-changer. Instead of wrestling with the built-in workflow language, you can just script it. It’s faster, cleaner, and doesn’t require chaining a dozen actions together just to manipulate a date or merge strings.

So next time you’re staring at an ugly @concat expression, ask yourself: “Could I just do this in PowerShell?” The answer is yes—and your future self will thank you.

2024 Year End – Azure Monitor

Let’s take a look back at the year and see what major features the Program Groups delivered!

Cya, old AppInsights!

One of the most notable milestones was the retirement of Classic Application Insights on February 29, 2024. This move encouraged users to transition to workspace-based resources, offering improved integration and advanced features within Azure Monitor.

Farewell MMA/OMS

Although some people will say OMS was never a thing (Bwren – talking about you), August 31, 2024, marked the retirement of the Log Analytics Agent (MMA/OMS). Users were advised to migrate to the Azure Monitor Agent (AMA) to benefit from enhanced performance, security, and support for new data sources.

Classic Storage Metrics

On January 9, 2024, classic metrics in Azure Storage were retired.

Enhanced Logging for AKS

December 2024 brought significant enhancements to Azure Kubernetes Service (AKS) logging. New metadata and log severity levels were introduced in Azure Monitor Logs, providing more granular insights into AKS operations.

Happy Birthday PowerShell!!

Today – November 14, 2024, PowerShell officially became an adult and celebrating its 18th birthday. From its humble beginnings as “Monad” to becoming a cross-platform automation powerhouse, PowerShell has come a long way. Take a moment to appreciate the journey and the community that has grown around this versatile tool.

October PowerShell Updates

October was a busy month this time! Lots of updates!

Azure PowerShell 12.5.0

October 2024 saw the release of Azure PowerShell 12.5.0, introducing several enhancements and fixes:

  • Az.AnalysisServices 1.1.6: Migrated the AnalysisServices SDK to a generated SDK, streamlining development and maintenance. Additionally, references to ‘Microsoft.Azure.Management.AnalysisServices’ were removed, reducing potential conflicts.
  • Az.Storage 7.2.0: Upgraded ‘Microsoft.Azure.Storage.DataMovement’ to version 2.0.5, improving data transfer capabilities and performance.
  • Az.StorageSync 2.3.0: Addressed issues with ‘Register-AzStorageSyncServer’ when using Azure FileSync Agent v17 and enhanced performance for Managed Identity migration cmdlets.
  • Az.Accounts 3.0.1: Introduced several fixes, including disabling WAM for device code flow or username/password (ROPC) flow to prevent potential token cache issues, resolving ‘KeyNotFoundException’ warnings, and limiting promotional messages to interactive scenarios only.
  • Az.Resources: Added properties ‘Condition’, ‘ConditionVersion’, and ‘Description’ to ‘New-AzRoleAssignment’, providing more granular control over role assignments.

For a comprehensive list of updates, refer to the official release notes.

PowerShell Universal 5.0.x

The team at Ironman Software was on a roll in October 2024, releasing multiple updates to PowerShell Universal – these folks are machines!

  • Version 5.0.10 (October 8, 2024): Introduced various enhancements and bug fixes, improving overall stability and performance.
  • Version 5.0.11 (October 15, 2024): Continued the trend with additional improvements, addressing user-reported issues and refining existing features.
  • Version 5.0.12 (October 18, 2024): Focused on performance optimizations and minor feature enhancements, ensuring a smoother user experience.
  • Version 5.0.13 (October 22, 2024): Addressed specific bugs and introduced minor feature updates, further stabilizing the platform.
  • Version 5.0.14 (October 31, 2024): Wrapped up the month with a release that included various enhancements and bug fixes, setting the stage for future developments.

September PowerShell Updates

Azure PowerShell 12.3.0

September saw the release of Azure PowerShell 12.3.0, packed with updates that made managing Azure resources feel like a breeze:

  • Az.Accounts 3.0.4: Introduced a customized UserAgent for ARM telemetry and fixed some documentation snafus where secrets were unintentionally exposed.
  • Az.Resources 7.5.0: Added ‘ResourceSelector’ and ‘Override’ parameters to ‘New/Update-AzPolicyAssignment’, giving you more control over policy assignments. Because who doesn’t like more knobs to turn?
  • Az.Storage 7.4.0: Issued a heads-up about an upcoming breaking change involving the removal of references to ‘Microsoft.Azure.Storage.File’ in ‘Start-AzStorageFileCopy’.

PowerShell Universal 5.0.7

Added an index to the database. If your service took its sweet time starting during the install, a manual schema update might have been in order.

PnP.PowerShell 2.12.0

SharePoint enthusiasts, rejoice! September 2024 brought us PnP.PowerShell 2.12.0, featuring:

  • WAM Login Support: For Windows users, this means support for Windows Hello, FIDO keys, and Conditional Access policies.
  • -SkipCertCreation Parameter: Added to ‘Register-PnPAzureADApp’, allowing you to prevent the creation and uploading of certificates in the Entra ID app.

Azure Monitor Baseline Alerts

Monitoring without a solid strategy is like driving without a dashboard—sooner or later, something’s going to break, and you won’t see it coming. That’s where Azure Monitor Baseline Alerts (AMBA) steps in, acting as your pre-configured, expert-driven monitoring blueprint for Azure resources.

Instead of spending hours manually configuring alerts, AMBA provides ready-to-deploy alert recommendations, automation templates, and best practices to ensure your environment stays resilient and well-monitored from day one.

Expert Recommendations: AMBA offers a curated list of alert recommendations and expert guidance tailored for various Azure resources, ensuring you’re always ahead of potential issues.

Proactive Notifications: With near real-time alerts, AMBA ensures you can swiftly identify and address problems, minimizing downtime and maintaining optimal performance.

Seamless Automation: Deploying alert policies has never been easier. AMBA’s Azure Policy templates allow for consistent and efficient implementation across your environment.

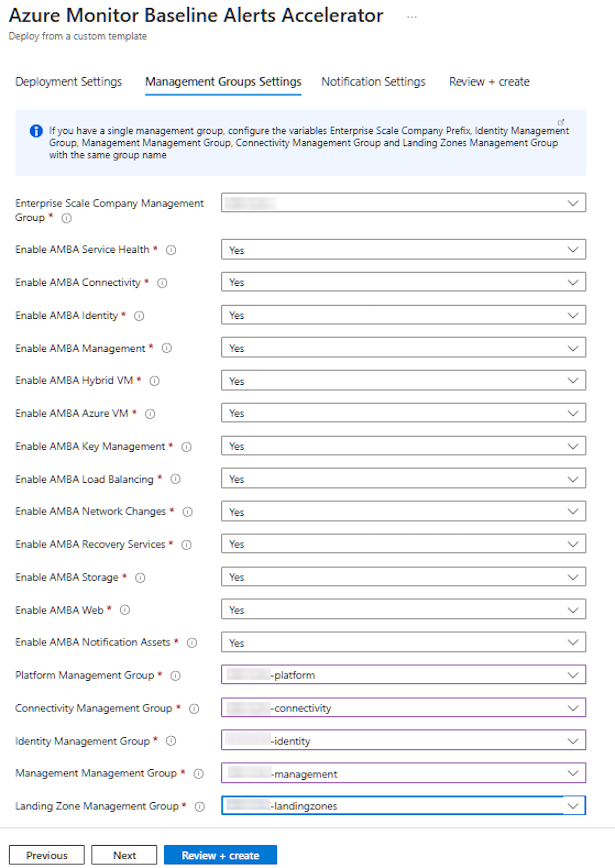
There are three main sections in AMBA – Resources, Patterns/Scenarios, and Visualizations. AMBA will deploy the necessary alerts based on resource level guidance with patterns (for Azure Landing Zones), along with various workbooks, dashboards – Azure or Grafana. And to top it all off – there is an accelerator now available for it! (see the image below)

Private Preview – Dynamic Log Alerts!

Let’s face it—manually setting alert thresholds in Azure Monitor can feel like trying to hit a moving target while blindfolded. Just when you think you’ve nailed the perfect threshold, your application’s behavior decides to take a detour, leaving you drowning in false positives or, worse, missing critical alerts. Azure Monitor’s dynamic thresholds for log search alerts are here to save the day!

Why Dynamic Thresholds Are a Game-Changer

Dynamic thresholds in Azure Monitor analyze historical data to establish expected performance patterns, automatically adjusting alert thresholds as your application’s behavior changes.

  • Automatic Calibration – Say goodbye to manual tuning. Dynamic thresholds adjust themselves based on your system’s historical data
  • Intelligent Learning – By understanding patterns and trends—be it daily spikes or weekly lulls—dynamic thresholds adapt to your application’s changing situations.
  • Scalable Alerts – Dynamic thresholds allow for a single alert rule to handle multiple dimensions, defining specific alert bands for each combination.

It’s still in Private Preview (boo!), but it won’t be long before we get our hands on it in public preview!

So what does it look like? Here is a sample ARM template that sets a dynamic threshold on CPU percentage – notice the new criterionType of DynamicThresholdCriterion.

{
  "$schema": "https://schema.management.azure.com/schemas/2019-04-01/deploymentTemplate.json#",
  "contentVersion": "1.0.0.0",
  "parameters": {
    "scheduledqueryrules_PerfDemoRule_name": {
      "defaultValue": "PerfDemoRule",
      "type": "String"
    },
    "workspaces_PerfDemoWorkspace_externalid": {
      "defaultValue": "/subscriptions/XXXX-XXXX-XXXX-XXXX/resourceGroups/XXXX/providers/Microsoft.OperationalInsights/workspaces/PerfDemoWorkspace",
      "type": "String"
    }
  },
  "resources": [
    {
      "type": "microsoft.insights/scheduledqueryrules",
      "apiVersion": "2024-01-01-preview",
      "name": "[parameters('scheduledqueryrules_PerfDemoRule_name')]",
      "location": "eastus2",
      "properties": {
        "displayName": "[parameters('scheduledqueryrules_PerfDemoRule_name')]",
        "severity": 3,
        "enabled": true,
        "evaluationFrequency": "PT5M",
        "scopes": [
          "[parameters('workspaces_PerfDemoWorkspace_externalid')]"
        ],
        "targetResourceTypes": [
          "Microsoft.Compute/virtualMachines"
        ],
        "criteria": {
          "allOf": [
            {
              "criterionType": "DynamicThresholdCriterion",
              "metricName": "Percentage CPU",
              "timeAggregation": "Average",
              "dimensions": [
                {
                  "name": "Computer",
                  "operator": "Include",
                  "values": [ "*" ]
                }
              ],
              "alertSensitivity": "Medium"
            }
          ]
        }
      }
    }
  ]
}

Why Not? Logic Apps + Home Assistant to Automate Your Cats Treat Dispenser

Alright, buckle up, folks – we’re diving into the absurd side of automation. Sure, Home Assistant can make your home smarter, but what if it could make your cat happier and financially savvy? Let’s build a system that dispenses treats based on stock market performance. Because why not tie your feline friend’s snack schedule to the whims of Wall Street?

This is overkill. It’s ridiculous. It’s everything you didn’t know you needed.

The Plan: Cats, Treats, and Capitalism

Here’s what we’re doing:

  1. Stock Price Check – Use Azure Logic Apps to pull daily stock prices for your favorite company (or your cat’s favorite, obviously). I prefer something like Alpha Vantage – it’s got a free tier and it’s easy to setup. https://www.alphavantage.co/
  2. Treat Dispensing Logic – Determine whether the stock is up or down and decide if treats should rain upon your furry roomate.
  3. Home Assistant Integration – Trigger a smart treat dispenser via a webhook.

Let’s get started!

If you don’t have a smart treat dispenser, DIY it. A smart plug attached to a motorized dispenser (or a cheap automatic feeder) works perfectly. I prefer these TPLink Matter Plugs. Connect it to Home Assistant and set up an automation:

alias: "Dispense Treats"
trigger:
  - platform: webhook
    webhook_id: "dispense_treats"
action:
  - service: switch.turn_on
    target:
      entity_id: switch.treat_dispenser
  - delay: "00:00:05"  # Dispense treats for 5 seconds
  - service: switch.turn_off
    target:
      entity_id: switch.treat_dispenser

Make sure you note the “webhook_id” – you will need it soon.

Create the Logic App

In Azure Portal, create a new Logic App (Consumption). Call it something fun, like WallStreetKitty. Add a Reoccurrance Trigger – maybe every 5 minutes or something like that. If you use a different API for the stock prices, make sure you know the number of calls you can make on your pricing tier. These sample below just checks once a day at 5pm (after the market closes).

{
  "recurrence": {
    "frequency": "Day",
    "interval": 1,
    "schedule": {
      "hours": [17],
      "minutes": [0]
    }
  }
}

Fetch Stock Prices

Add an HTTP action to call a stock API (e.g., Alpha Vantage). Example setup:

  1. Method: GET
  2. URI: https://www.alphavantage.co/query?function=TIME_SERIES_INTRADAY&symbol=MSFT&interval=1min&apikey=YourAPIKey

Replace MSFT with the ticker symbol of your choice – or your cat’s favorite stock. The actual json you get from Alpha Vantage might be something like this:

{
  "Meta Data": {
    "1. Information": "Intraday (1min) open, high, low, close prices and volume",
    "2. Symbol": "MSFT",
    "3. Last Refreshed": "2024-05-01 16:00:00",
    "4. Interval": "1min",
    "5. Output Size": "Compact",
    "6. Time Zone": "US/Eastern"
  },
  "Time Series (1min)": {
    "2024-05-01 16:00:00": {
      "1. open": "309.6200",
      "2. high": "310.0000",
      "3. low": "309.1500",
      "4. close": "309.9200",
      "5. volume": "1234567"
    },
    "2024-05-01 15:59:00": {
      "1. open": "309.5000",
      "2. high": "309.8000",
      "3. low": "309.1000",
      "4. close": "309.6200",
      "5. volume": "987654"
    }
  }
}

So your next step is to parse the json – add a parse JSON step and use this schema:

{
  "type": "object",
  "properties": {
    "Meta Data": {
      "type": "object",
      "properties": {
        "2. Symbol": { "type": "string" },
        "3. Last Refreshed": { "type": "string" }
      }
    },
    "Time Series (1min)": {
      "type": "object",
      "additionalProperties": {
        "type": "object",
        "properties": {
          "1. open": { "type": "string" },
          "2. high": { "type": "string" },
          "3. low": { "type": "string" },
          "4. close": { "type": "string" },
          "5. volume": { "type": "string" }
        }
      }
    }
  }
}

We want 4 – the CLOSE value. We just need to extract it from the JSON –

@body('Parse_JSON')?['Time Series (1min)']?[body('Parse_JSON')?['Meta Data']?['3. Last Refreshed']]?['4. close']

Now we need to add a condition – we don’t want Tabby to get fat if the stocks aren’t doing well, right??

@greater(float(body('Extract_Stock_Price')),float(variables('Previous_Price')))

If True – continue. If False, well someones going to not be happy. Let’s assume that the stocks are going to do well, so let’s call out to Home Assistant.

Call Home Assistant

In the True branch, add an HTTP action to trigger the treat dispenser:

  1. Method – POST
  2. URI – https://your-homeassistant-instance/api/webhook/<<that webhook id I told you to remember>>. For example – https://your-homeassistant-instance/api/webhook/dispense_treats
  3. Headers – Add your Home Assistant authentication token.

Bonus Round: Go Big or Go Home

  • Track Multiple Stocks – Add a loop to monitor multiple ticker symbols and dispense extra treats for each one in the green.
  • Add Notifications – Send a Teams message or email with the stock performance and treat status.
  • Cat Mood Analytics – Track treat frequency and correlate it with your cat’s nap times in a Power BI dashboard.

Did we need to do this? Nope. Is this useful? Also No. Do I currently have a cat? Also No. Do I have too much time on my hands? I will let you decide.